
Building off my previous post, in which I introduced a neat superhero dataset and presented graphical descriptions of the data, in this post I would like to address differences in traits between superheroes and supervillains.
1. Descriptive Statistics
Below, I’ve included mean ratings for both superheroes and supervillains.
| Variable | Mean for Supervillains (n=123) | Mean for Superheroes (n=304) |
| Intelligence | 67.46 | 60.22 |
| Strength | 46.11 | 38.17 |
| Speed | 37.03 | 38.26 |
| Durability | 62.00 | 56.28 |
| Power | 59.67 | 55.48 |
| Combat | 59.87 | 60.50 |
| Total | 332.15 | 308.91 |
| Source: http://www.superherodb.com | ||
Surprisingly, we can see that, on average, the villains possess higher total ratings (sum of the six ratings) than do the heroes. However, we (or at least I) typically think of superheroes as being superior to their rivals. On the other hand, creating villains to be more extraordinary creatures than their counterparts makes the heroes’ ultimate triumphs even more impressive. This makes for good underdog stories.
Now, let’s add variance into the equation and look at boxplots of the data.
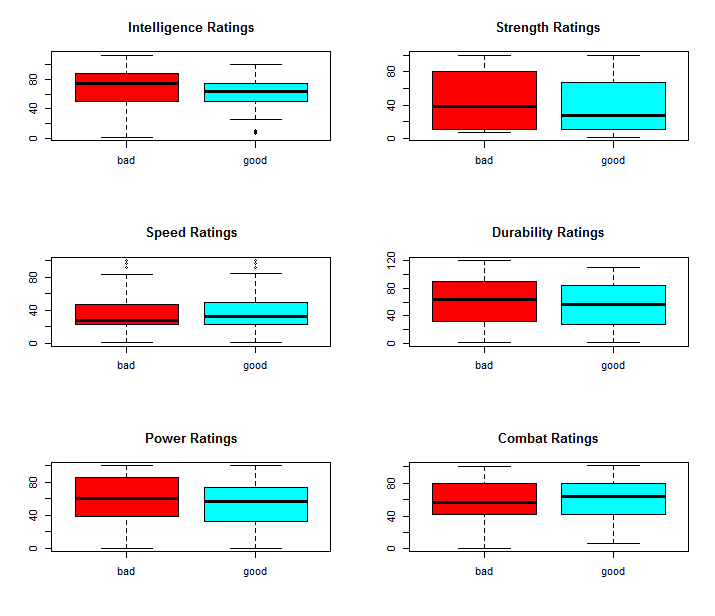
Note: “bad” refers to villains and “good” refers to heroes
Without any formal discussion, I’ll make a quick remark about the spread of the ratings. There is more spread (as measured by standard deviation) in ratings for villains in 5 of the 6 categories (all but combat). Practically, this leads me to believe that villains are more diverse in makeup than heroes. For an anecdotal example, Joker is a very different villain than Blob.
| Name | Intelligence | Strength | Speed | Durability | Power | Combat |
| Joker | 100 | 10 | 12 | 56 | 22 | 90 |
| Blob | 10 | 83 | 23 | 95 | 26 | 72 |
| Difference | 90 | -73 | -11 | -39 | -4 | 18 |
2. Incorporating Uncertainty
From the analysis so far, one can easily see that there are differences in the average scores between villains and heroes. Now, I was tempted to take these differences as “real” but, upon further consideration, second-guessed myself.
I faced a statistical conundrum which statisticians working with real world data rarely, if ever, face. The reason I was tempted to say, for instance, that villains are about 4 points more powerful than heroes is because I thought my sample was essentially the population. Upon further examination, however, I recalled that I had cut 171 subjects from my sample because of missing values and that there are probably superheroes and supervillains out there not included in the superhero database. So, since my sample is just that, a sample, I decided to incorporate some uncertainty into my estimates. (Now, if this were a real world problem, I would need to be sure that my missing data were missing at random to assure that I was working with a random sample. In this case, I will make that assumption and proceed, though it is probably not valid. I think that the results will still be interesting and worthy of discussion).
Below are estimated ranges for the true differences between supervillains and superheroes for each of the six ratings categories.
| Variable | 95% CI of Mean (Villain-Hero) |
| Intelligence | (2.5336, 11.9591) |
| Strength | (1.2240, 14.6616) |
| Speed | (-6.0548, 3.5935) |
| Durability | (-0.5996, 12.0338) |
| Power | (-1.5122, 9.8915) |
| Combat | (-5.4797, 4.2130) |
After incorporating uncertainty, we only detect significant disparities in two (intelligence and strength) of the six categories. If I were to account for multiple comparisons, then only intelligence would differ significantly between the two groups.
3. P (Hero | Characteristics)
Now that we have been exposed to at least some evidence to suggest that there are detectable differences in traits between superheroes and supervillains, I am interested in answering the following question:
Given that a character possesses a particular set of ratings, can we predict if that character will be a hero or a villain?
“Practically”, this would allow one to predict the alignment of a new member to the world of superheroes and supervillains.
To address this question, I created a logistic regression model. Overall, I would say that the model does not do a great job of predicting alignment (perhaps due to the considerable amount of variability among both heroes and villains), but there is still some useful information which I will share. I’ll present these results in terms of odds ratios.
| Effect | Point Estimate | 95% Wald Confidence Limits |
| Intelligence | 0.982 | (0.971, 0.993) |
| Strength | 0.992 | (0.982, 1.001) |
| Speed | 1.012 | (1, 1.023) |
| Durability | 0.998 | (0.987, 1.008) |
| Power | 0.998 | (0.989, 1.008) |
| Combat | 1.008 | (0.998, 1.019) |
When controlling for other ratings, intelligence and speed play a significant role in predicting alignment. Here are their interpretations:
- Holding other factors fixed, a one unit increase in intelligence rating decreases the odds that a character is a superhero by 1.8%.
- Holding other factors fixed, a one unit increase in speed rating increases the odds that a character is a superhero by 1.2%.
4. Conclusions
In my mind, the biggest takeaway from this analysis is the role that intelligence plays in distinguishing superheroes from supervillains. The villains possess significantly higher levels of intelligence than their enemies, the heroes. I guess it makes for a good story when the good guy outwits the evil mastermind.
******************************************************************************
As in Pt. I, I was working with this dataset.
Below is code used, which, for this particular post, I feel is rather straightforward.
R code for the boxplots:
#create a panel of boxplots; separate by alignment
hero_vill <- read.csv("~/Blog/hero_vill.csv", stringsAsFactors=TRUE)
par(mfrow=c(3,2))
boxplot(hero_vill$Intelligence~hero_vill$Alignment, col=rainbow(2), main="Intelligence Ratings")
boxplot(hero_vill$Strength~hero_vill$Alignment, col=rainbow(2), main="Strength Ratings")
boxplot(hero_vill$Speed~hero_vill$Alignment, col=rainbow(2), main="Speed Ratings")
boxplot(hero_vill$Durability~hero_vill$Alignment, col=rainbow(2), main="Durability Ratings")
boxplot(hero_vill$Power~hero_vill$Alignment, col=rainbow(2), main="Power Ratings")
boxplot(hero_vill$Combat~hero_vill$Alignment, col=rainbow(2), main="Combat Ratings")
SAS code for t-tests & logistic regression:
*data processing;

data hero_vill;

infile "~/Blog/hero_vill_1.csv" dlm=',' dsd missover;

input Name :$32. Alignment $ Intelligence Strength Speed Durability Power Combat Total;

if Alignment='good' then Hero=1;

else if Alignment='bad' then Hero=0;

else delete;

run;

*t-tests;

proc ttest data=hero_vill plots=none;

class alignment;

var intelligence;

run;

proc ttest data=hero_vill plots=none;

class alignment;

var strength;

run;

proc ttest data=hero_vill plots=none;

class alignment;

var speed;

run;

proc ttest data=hero_vill plots=none;

class alignment;

var durability;

run;

proc ttest data=hero_vill plots=none;

class alignment;

var power;

run;

proc ttest data=hero_vill plots=none;

class alignment;

var combat;

run;

*logistic regression;

proc logistic data=hero_vill;

model Hero(event='1')=Intelligence Strength Speed Durability Power Combat;

run;

Pingback: What is the best superhero TV show? | Jon's Jibber-Jabber